
| 일 | 월 | 화 | 수 | 목 | 금 | 토 |
|---|---|---|---|---|---|---|
| 1 | ||||||
| 2 | 3 | 4 | 5 | 6 | 7 | 8 |
| 9 | 10 | 11 | 12 | 13 | 14 | 15 |
| 16 | 17 | 18 | 19 | 20 | 21 | 22 |
| 23 | 24 | 25 | 26 | 27 | 28 | 29 |
| 30 |
- learning algorithms
- 인공신경망
- ChatGPT
- 챗지피티
- prompt
- Regression
- 머신러닝
- GPT
- Scikitlearn
- nlp
- 인공지능
- coursera
- LLM
- Andrew Ng
- llama
- Deep Learning
- 언어모델
- AI
- ML
- neural network
- 프롬프트 엔지니어링
- Machine Learning
- feature engineering
- Unsupervised Learning
- 딥러닝
- bingai
- AI 트렌드
- feature scaling
- Supervised Learning
- supervised ml
- Today
- Total
My Progress
[Supervised ML] Regression/ Cost function - 2 본문
1. Linear Regression
Purpose: To predict the output based on the given examples or dataset
1. 1 Terminology

Univariate linear regression: Linear regression with one(single feature x) variable
fw,b(x) = wx + b
1.2 Code
Necessary Libraries
#Numpy, a popular library for scientific computing
import numpy as np
#Matplotlib, a popular library for plotting data
import matplotlib.pyplot as plt

x_train = np.array([1.0 , 2.0])
y_train = np.array([300, 500])

#Number of training examples
m = len(x_train)
Plotting the data
# Plot the data points
plt.scatter(x_train, y_train, marker = "x", c = "r")
# Set the title
plt.title("Housing Prices")
# Set the y-axis label
plt.ylabel("Price")
#Set the x-axis label"
plt.xlabel("Size")
plt.show()
Calculating Model output
def calculate_model_output(w, b, x):
	#Find the dimension of x
	m = x.shape
    #Fill in the array with the dimension of x
    f_wb = np.zeros(m)
    for i in range(len(x)):
    	f_wb[i] = w * x[i] + b

    return f_wb
Implementation
tmp_f_wb = calculate_model_output(w, b, x_train)

# Plotting our model prediction
# plt.plot = contiguous line / c == "color
plt.plot(x_train, tmp_f_wb, c= "b", label = "Our prediction")

#Plot the data points
#plt.scatter = scatterplot
plt.scatter(x_train, y_train, marker = "x", c = "r', label = "Actual Values)

#Set the title and axis
plt.title("Housing Prices")
plt.xlabel(size)
plt.ylabel(Price)
# Shows the label
plt.legend()
plt.show()
2. Cost function
Purpose: To check how well the model is doing and how can we make it better
In f(x) = wx + b, w and b are parameters
We can find w,b by finding y-hat(i) close y(i) for all (x(i), y(i))
2.1 Cost Function Formula
Q:How do we measure the performance of the model?
A: By measuring the difference between the estimate output of the model and the actual output of the dataset
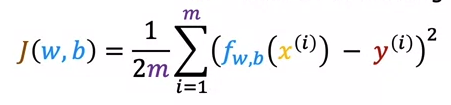
1/(2m) meant to make later calculation better
Q: What is the purpose of using Squared Error Cost function?
A: Squaring the cost emphasizes relatively large cost and also eliminates the negative cost values.
2.2 Cost Function Intuition
Goal of Linear Regression:

Example:
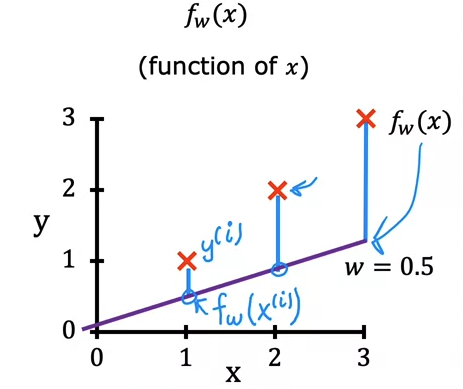
2.3 Visualization Examples

2.4 Cost function code
def compute_cost(x, y, w, b):

    m = len(x)
    cost = 0

    for i in range(m):

        #calculate the model predication
        f_wb = w * x[i] + b

        #calculate the cost
        cost = cost + (f_wb - y[i])**2

    total_cost = 1/ (2 * m) * cost

return total_cost'AI > ML Specialization' 카테고리의 다른 글
| [Supervised ML] Gradient descent / Learning Rate - 6 (0) | 2023.07.28 |
|---|---|
| [Supervised ML] Feature scaling - 5 (0) | 2023.07.28 |
| [Supervised ML] Multiple linear regression - 4 (0) | 2023.07.28 |
| [Supervised ML] Gradient Descent - 3 (0) | 2023.07.27 |
| [Supervised ML] Supervised/Unsupervised - 1 (0) | 2023.07.26 |


